Retrieving Quadrix«
Scores By Ticker Symbol
The Quadrix stock-rating system is a proprietary
quantitative system for uncovering attractive stocks. Quadrix uses more
than 100 variables to rank more than 4,000 U.S. stocks
and assign them ratings on a scale from 0 (lowest) to 100 (highest). In
designing the Quadrix system, variables were selected based on their
long-term record as stock-price predictors.
Dow Theory Forecasts has been successfully using Quadrix
to select stocks since 1998. Since we began publishing Quadrix scores in the
Forecasts in January 2000, Quadrix has achieved impressive results (see
chart). While past performance is no indication of future results, the
Quadrix system can be an excellent tool for finding attractive buy candidates
and monitoring current holdings.
Quadrix track record
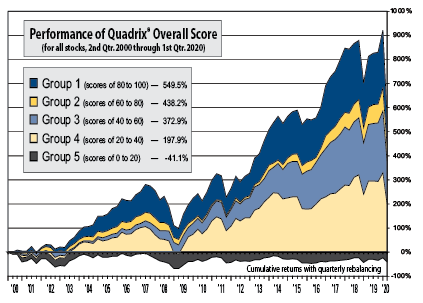
Over the last 80 quarters, Quadrix has done a good job of predicting leaders and laggards. Assuming quarterly rebalancing, a portfolio that held equal-dollar positions in the top one-fifth of U.S. stocks based on Quadrix Overall scores (Group 1 in the chart above)
would have gained 549.5%. A portfolio holding only the bottom one-fifth of scorers (Group 5) would have lost 41.1%.
Quadrix has also proved highly effective in back-testing to 1990, and the tools listed below are designed to let you take full advantage of Quadrix's time-tested power:
Quadrix by Ticker – See Quadrix scores and other vital information on a single stock.
Quadrix Comparison – Compare Quadrix scores for a group of stocks.
Industry-Group Studies – See which industries have the best Quadrix scores and share-price momentum.
Prescreened Quadrix Reports – Review stocks that meet our predefined Quadrix screens.
Portfolio Manager – Build and save a portfolio of stocks for ready access to Quadrix scores.
Under the Quadrix system, each stock is assigned an Overall Quadrix rank on a scale from
0 (lowest) to 100 (highest). The Overall Quadrix rank is based on
the ranks for seven major categories --Momentum, Value, Quality, Financial Strength, Earnings
Estimates, Performance, and Volume
Metrics. The ranks for these seven categories is in turn calculated from the ranks
for over 100 data variables.
To retrieve Quadrix scores for one or more stocks,
please type in the ticker symbol for each security and then click on the
Get Scores button. Be sure to separate each ticker symbol
with either a space or comma. If you make a mistake or wish to start over, you may use the Reset
button to clear the display.
Once you view the results by clicking the Get Scores button, you have several
options. If you wish to retrieve the Quadrix scores for a different stock or
group of stocks, click the Return button. Or if you wish to sort the results
in either ascending or descending order, click on the respective column heading.
The order in which the data is sorted will alternate on each click. To
see detailed information about a particular stock, click on its ticker
symbol.
Certain companies have more than one class of stock, and
various financial data sources might list the ticker symbols for the two classes
in a variety of ways. To eliminate confusion, we do not differentiate between
different classes of stock and omit the final class character (such as an "A" or
"B" ) in the ticker symbol.
In any case, if you are unsure of the ticker symbol for a particular stock,
you may look it up by typing in the name of the stock in the lower section and
then clicking the Get
Ticker button. You do not need to type in the full name of the stock.
Any letters in the stock's name will do. For example, to find the ticker symbol
for Home Depot, you may type in "Home Depot", "Depot", "Home", or even just
"Ho", if you wish. If you make a mistake or wish to start over, you may use the
Reset button to clear the display.
Return To Top
About
Quadrix
Quadrix considers more than 100 variables in seven
categories ľ momentum, quality, value, financial strength, earnings estimates,
performance, and volume metrics. Used together, these scores can help you find
winners and avoid losers.
To be sure,
no numbers-based ranking system can substitute entirely for company analysis.
Stocks cannot be reduced to a series of equations. Often what really matters
about a companyĺs stock is not on the balance sheet or income statement. For
example, Quadrix can tell you which drug companies have done best in growing
earnings and sales, but it cannot tell you the companies with the best new drugs
in the pipeline.
Still, a
numerical ranking system like Quadrix can be a great first screen for building
portfolios. Because the system uses only quantifiable factors, it allows you to
narrow your focus on companies achieving superior results. Similarly, because
Quadrix is not influenced by the fear, hope, and greed that can occasionally
cloud the judgment of all investors, the system is an excellent tool for
tracking current portfolio holdings.
Return To Top
Quadrix
Overview
Quadrix
uses more than 100 variables to score stocks in seven categories Ś momentum,
quality, value, financial strength, earnings estimates, performance, and volume
metrics. Within each category, some variables are weighted more heavily based on
past effectiveness. To compute an overall score, Quadrix uses a weighted average
of the seven category scores, with value, quality, and momentum receiving the
biggest weightings. Based on past effectiveness or expectations regarding market
conditions, weightings for the more than 100 individual variables or the seven
categories may be changed.
For the
most part, the Forecasts uses overall Quadrix scores to find likely 12-month
winners. Subscribers with shorter or longer time horizons may want to tailor the
system to their needs, so it helps to know the significance of each
category.
Momentum. To compute momentum
scores, Quadrix ranks the universe of more than 4,200 stocks on 10
variables related to near-term growth in earnings, cash flow, and sales. For
example, a company that scores in the top 1% for 12-month sales growth receives
a 100 for that variable. For a company that scores better than only 5% of the
companies for 12-month sales growth, the score for that variable would be
5.
For each of
the momentum variables, each stock is compared to the universe of all stocks. To
calculate the momentum score, the sum of a stockĺs scores for each variable is
compared to the universe of stocks. For example, if a stock receives a momentum
score of 75, that means the average of its momentum scores is higher than 75% of
the universe.
Many
investors rely solely on momentum factors when picking stocks. But Quadrix
uses a more balanced approach, partly because companies with high momentum
scores often have overvalued stocks. Also, because our momentum variables look
back no further than 12 months, momentum scores can unduly reward companies
experiencing a temporary acceleration in business.
Still,
partly because it can help eliminate companies suffering from deteriorating
fundamentals, momentum receives a healthy weighting in the Quadrix system. In
fact, you should be wary of stocks with high overall Quadrix scores that do not
score well for momentum. Such scores sometimes reflect a temporary slowdown, but
they can also point to a former blue chip headed for trouble.
By
definition, momentum factors are short term in nature. So, if you buy a
low-quality or overvalued stock simply because of its momentum score, the risk
posed by an earnings slowdown is substantial. The shorter your time horizon, the
more important is momentum.
Quality. The quality score is an excellent
gauge of a companyĺs track record. Of the 22 quality variables, 17 are growth
rates for sales, earnings, cash flow, common equity, and dividends. The other
five variables include expected profit growth, earnings consistency, profit
margins, return on equity, and return on assets.
Growth
rates for the past one, three, and five years are used. So, companies with
outstanding 10- or 20-year track records are given no credit beyond the last
five years. Companies lacking five-year track records are evaluated based on the
average ranks for the quality variables for which they do have numbers, the
methodology Quadrix uses for all missing variables.
Companies
with the best growth records score highest for quality. While a good history is
no guarantee of future success, companies with stellar growth records tend to be
well-managed businesses with attractive market positions. Because Quadrix
measures growth in five areas Ś sales, earnings, shareholders equity, cash flow,
and dividends Ś it penalizes companies growing earnings through cost-cutting or
restructuring charges.
One
shortcoming of Quadrix is the reward it gives companies that have grown through
acquisitions. Many of Wall Streetĺs best growth companies have benefited from
acquisitions, including Automated Data Processing, Citigroup, and General
Electric. But, in general, a company growing internally is more valuable than a
company growing only through acquisitions. For that reason, the
Forecasts and Upside take a closer look at any high Quadrix scorer
with a penchant for acquisitions. Also, Quadrix uses per-share growth rates,
which tempers the scores of companies that grow through stock swaps.
Value.
Quadrixĺs 17 value variables include such ratios as price/earnings (P/E),
price/sales, price/cash flow, price/book value, price/dividend, and P/E relative
to expected growth (PEG). In addition, the ratios are compared to the average
level of the ratios over the past three and five years.
Since March
2000, value investing has been quite effective. The approach lagged through much
of 1998 and 1999, but many traditional value groups now trade at historically
rich valuations. Still, there is no shortage of value plays in the broader
market, and we expect the first issues to benefit from any lasting rebound in
the market will be reasonably valued stocks supported by earnings and sales
momentum. With some exceptions, the Forecasts sees little reason to bet on
deep-discount value stocks lacking solid track records or strong market
positions.
Financial
Strength. Quadrix uses seven variables in computing financial
strength. The scores reflect interest coverage, debt positions, and profit
margins. A bankruptcy prediction variable is used to forecast the risk of
financial failure in the short term. Cash flow variables are used to measure
default risk.
Financial-strength scores can help weed out companies with
weak financial positions. Companies with solid balance sheets score best for
financial strength. By itself, a companyĺs financial-strength score is not a
great predictor of stock performance. However, a low financial-strength score is
a yellow flag worth investigating.
For
industry groups that typically use a lot of debt Ś including banking, financial
services, insurance, and utilities Ś Quadrix financial-strength scores can be
unduly low. For stocks in such sectors, financial-strength scores are most
meaningful relative to industry peers.
Earnings
Estimates. By tracking the trend in consensus earnings estimates, you
can check whether company fundamentals are supporting a stockĺs price action.
Also, estimate revisions have been a good screen for avoiding companies likely
to post negative profit surprises. The Quadrix earnings estimate score is based
on more than 10 variables that measure the change in consensus earnings
estimates for coming quarters, this fiscal year, and next fiscal year. Earnings
estimates scores can be quite volatile, so the category does not receive a big
weighting in the overall Quadrix score. However, for stocks with low earnings
estimates scores, you should determine whether the negative revision trends are
already reflected in the stock price.
Performance.
The Quadrix performance score reflects a stockĺs total returns
relative to other stocks. Total returns (dividends plus stock-price change) are
computed for six periods ranging from one week to 12 months. By evaluating a
stockĺs relative strength over different periods, the Quadrix performance score
can help identify stocks showing consistently superior performance. Performance
scores should be watched closely, but they do not receive a big weighting in
Quadrix. In general, the shorter your time horizon, the more you should
emphasize performance scores. If performance scores are weak even though company
fundamentals appear strong, you should evaluate whether the company faces
near-term problems.
Volume
Metrics. Quadrix volume metrics scores are based on a stockĺs recent
trading volume relative to its historical trading volume. When trading volume
jumps, a stockĺs score for volume metrics will improve. Because all stocks are
evaluated on a relative basis, a market-wide increase in trading volume will not
impact the score for volume metrics. Up to eight periods are evaluated to
compute the volume metrics score. Historically, trading volume has been a good
tool for finding stocks likely to post big moves. However, those big moves can
be to the upside or the downside. So, while the volume metrics score can be an
effective tool for finding stocks that deserve a closer look, the score is not
included in the overall Quadrix score. We are doing more work on
defining the relationship between trading volume and future stock-price action,
so volume metrics may be used in the overall score in the future.
Return To Top